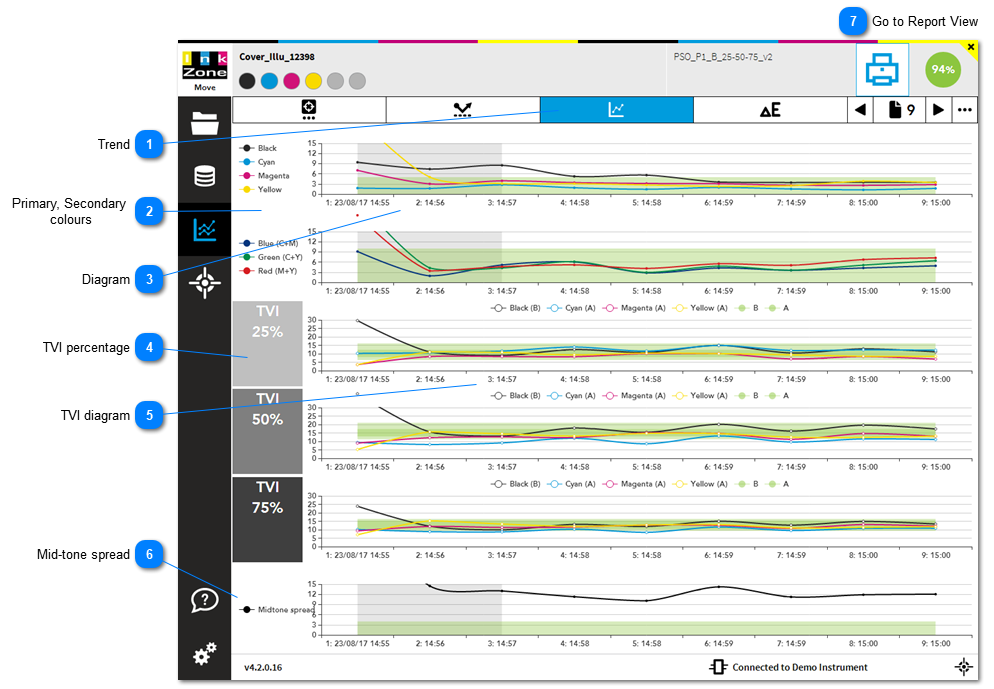
1.4.2.6. Trend on Lab and TVI
Shows Lab trend for primary and secondary colours, trend for TVI plus the mid-tone spread.
 TrendOpens trends
|
|
 Primary, Secondary
coloursClick on a colour here to toggle it on or off in the graph.
|
|
 DiagramDisplay of a color is toggled on and off by clicking on the color's name on the right.
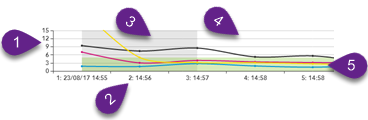
1) DeltaE scale
2) Measurement number and time stamp
3) Grey area = status MakeReady mode
4) White area = status Production mode
5) Green area = tolerance
|
|
 TVI percentageDepending on the target and scoring setup the trend for the TVI percentage are shown here.
|
|
Dot gain 25% (quarter tone)
Dot gain 50% (mid tone)
Dot gain 75% (three quarter tone)
|
|
|
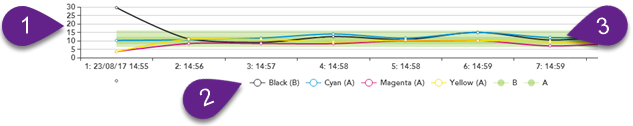
 TVI diagram1) TVI percentage scale
2) Toggle diagram colours on and off
3) Tolerance area
|
|
 Mid-tone spreadCMY mid-tone spread
|
|
 Go to Report View |
|