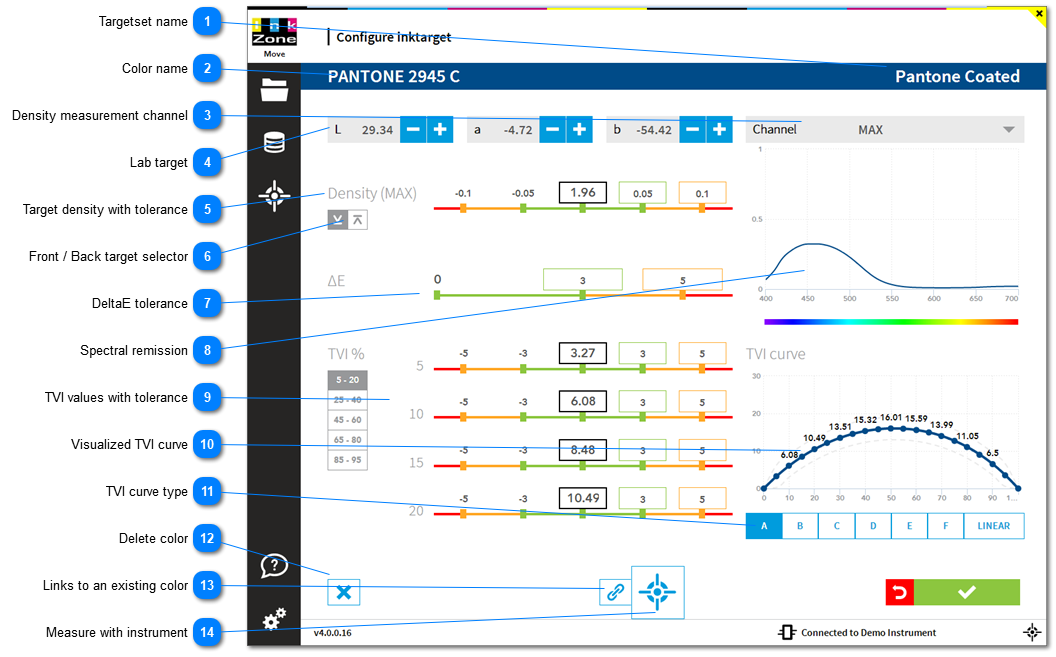
Targetset nameThe spot color targetset where the color is assigned to
|
 Color nameColor name
|
 Density measurement channelUsually the density filter channel for measuring a spot color with a spectrophotometer is set to MAX, meaning the maximum peak from its remission. Nevertheless, it is possible to change the filter to K, C, M or Y
|
 Lab targetLab target value
|
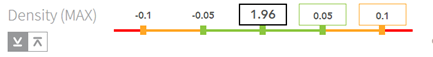
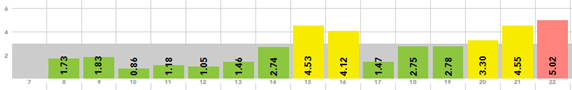
 Target density with toleranceTarget density with tolerance
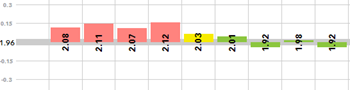
With this setup the density for a front side measurement is displayed as:
|
< 1.86
|
red
|
|
1.86 - 1.90
|
yellow
|
|
1.91 - 2.01
|
green
|
|
2.02 - 2.06
|
yellow
|
|
> 2.06
|
red
|
|
|
|
|
 Front / Back target selectorSetup an individual density target for front and back side.
|
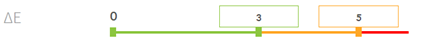
 DeltaE toleranceColor tolerance in DeltaE
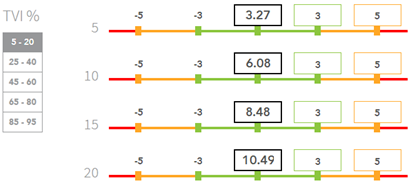
With this setup the DeltaE for a front and back measurement is displayed as:
|
0 - 3
|
green
|
|
3.01 - 5
|
yellow
|
|
> 5
|
red
|
|
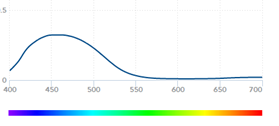
 Spectral remissionSpectral remission curve
|
 TVI values with toleranceTVI curve values and their tolerance
|
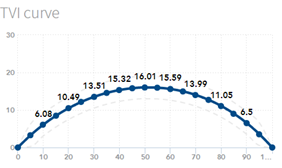
 Visualized TVI curveVisualized TVI curve with the TVI expected value for 5 to 95%.
|
 TVI curve typeISO 12647-2 uses different sets of predefined TVI curves named A to F.
A linear curve is when the dot gain is expected like
5%Tone TVI=5;
10%Tone TVI=10;
etc.
|
 Delete colorDeletes the color
|
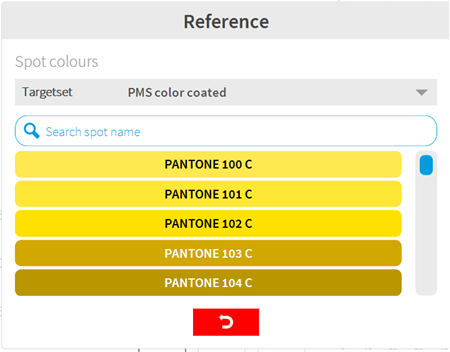
 Links to an existing colorCreate a link to an existing spot color.
Select the reference color in the dialog. Use the search to filter the color list.
|
 Measure with instrumentPlace the instrument on the sample and start the color reading with this button. Alternatively, use the instrument measurement button.
|
|